In-silico perturbation with CellOracle (backend='cell_oracle')#
Reproduce the published CellOracle Paul15 Gata1-KO benchmark
(Kamimoto et al. 2023 Nature
Fig. 2-3) through the unified ov.single.perturb API.
%matplotlib inline
import omicverse as ov
ov.plot_set(font_path='Arial')

import celloracle as co
import matplotlib.pyplot as plt
🔬 Starting plot initialization...
Using already downloaded Arial font from: /tmp/omicverse_arial.ttf
Registered as: Arial
🧬 Detecting GPU devices…
✅ NVIDIA CUDA GPUs detected: 1
    • [CUDA 0] NVIDIA H100 80GB HBM3
      Memory: 79.1 GB | Compute: 9.0

   ____            _     _    __
  / __ \____ ___  (_)___| |  / /__  _____________
 / / / / __ `__ \/ / ___/ | / / _ \/ ___/ ___/ _ \
/ /_/ / / / / / / / /__ | |/ /  __/ /  (__  )  __/
\____/_/ /_/ /_/_/\___/ |___/\___/_/  /____/\___/

🔖 Version: 2.2.1rc1   📚 Tutorials: https://omicverse.readthedocs.io/
✅ plot_set complete.
1. Load the official Paul15 dataset + scATAC base GRN#
adata = co.data.load_Paul2015_data()
base_grn = co.data.load_mouse_scATAC_atlas_base_GRN()
adata
AnnData object with n_obs × n_vars = 2671 × 1999
    obs: 'paul15_clusters', 'n_counts_all', 'n_counts', 'louvain', 'cell_type', 'louvain_annot', 'dpt_pseudotime'
    var: 'n_counts'
    uns: 'cell_type_colors', 'diffmap_evals', 'draw_graph', 'iroot', 'louvain', 'louvain_annot_colors', 'louvain_colors', 'louvain_sizes', 'neighbors', 'paga', 'paul15_clusters_colors', 'pca'
    obsm: 'X_diffmap', 'X_draw_graph_fa', 'X_pca'
    varm: 'PCs'
    layers: 'raw_count'
    obsp: 'connectivities', 'distances'
# Normalize from raw counts + select HVGs (one omicverse call)
adata.X = adata.layers['raw_count'].copy()
adata = ov.pp.preprocess(adata, mode='shiftlog|pearson', n_HVGs=3000,
                         organism='mouse')
🔍 [2026-05-25 18:46:45] Running preprocessing in 'cpu' mode...
Begin robust gene identification
    After filtration, 1999/1999 genes are kept.
    Among 1999 genes, 1999 genes are robust.
✅ Robust gene identification completed successfully.
Begin size normalization: shiftlog and HVGs selection pearson

🔍 Count Normalization:
   Target sum: 500000.0
   Exclude highly expressed: True
   Max fraction threshold: 0.2
   ⚠️ Excluding 1 highly-expressed genes from normalization computation
   Excluded genes: ['Prg2']

✅ Count Normalization Completed Successfully!
   ✓ Processed: 2,671 cells × 1,999 genes
   ✓ Runtime: 0.04s

🔍 Highly Variable Genes Selection (Experimental):
   Method: pearson_residuals
   Target genes: 3,000
   Theta (overdispersion): 100
✅ Experimental HVG Selection Completed Successfully!
   ✓ Selected: 1,999 highly variable genes out of 1,999 total (100.0%)
   ✓ Results added to AnnData object:
     • 'highly_variable': Boolean vector (adata.var)
     • 'highly_variable_rank': Float vector (adata.var)
     • 'highly_variable_nbatches': Int vector (adata.var)
     • 'highly_variable_intersection': Boolean vector (adata.var)
     • 'means': Float vector (adata.var)
     • 'variances': Float vector (adata.var)
     • 'residual_variances': Float vector (adata.var)
    Time to analyze data in cpu: 0.59 seconds.
✅ Preprocessing completed successfully.
    Added:
        'highly_variable_features', boolean vector (adata.var)
        'means', float vector (adata.var)
        'variances', float vector (adata.var)
        'residual_variances', float vector (adata.var)
        'counts', raw counts layer (adata.layers)
    End of size normalization: shiftlog and HVGs selection pearson

╭─ SUMMARY: preprocess ──────────────────────────────────────────────╮
│  Duration: 0.606s                                                  │
│  Shape:    2,671 x 1,999 (Unchanged)                               │
│                                                                    │
│  CHANGES DETECTED                                                  │
│  ────────────────                                                  │
│  ● VAR    │ ✚ highly_variable (bool)                               │
│           │ ✚ highly_variable_features (bool)                      │
│           │ ✚ highly_variable_rank (float)                         │
│           │ ✚ means (float)                                        │
│           │ ✚ residual_variances (float)                           │
│           │ ✚ robust (bool)                                        │
│           │ ✚ variances (float)                                    │
│                                                                    │
│  ● UNS    │ ✚ REFERENCE_MANU                                       │
│           │ ✚ _ov_provenance                                       │
│           │ ✚ history_log                                          │
│           │ ✚ hvg                                                  │
│           │ ✚ log1p                                                │
│           │ ✚ status                                               │
│           │ ✚ status_args                                          │
│                                                                    │
│  ● LAYERS │ ✚ counts (array, 2671x1999)                            │
│                                                                    │
╰────────────────────────────────────────────────────────────────────╯
# Force-keep canonical hematopoietic TFs even if they're not in the HVG set
KEEP = ['Gata1','Klf1','Spi1','Gata2','Cebpa','Tal1','Runx1',
'Hbb-bt','Hbb-bs','Hba-a1','Hba-a2','Alas2','Gypa',
'Slc4a1','Epor','Mpo','Lyz2','Elane']
mask = adata.var['highly_variable'].copy()
for g in KEEP:
if g in adata.var_names: mask[g] = True
adata = adata[:, mask].copy()
adata.obsm['X_umap'] = adata.obsm['X_draw_graph_fa'][:, :2].copy()
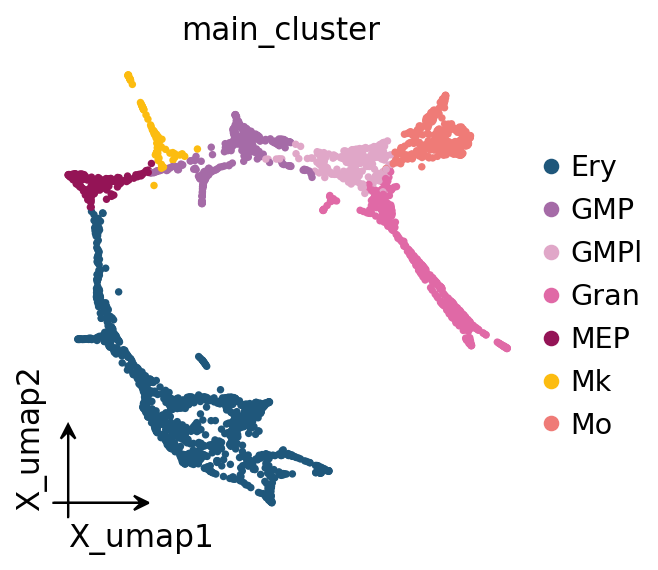
adata.obs['main_cluster'] = (adata.obs['louvain_annot'].astype(str)
.str.split('_').str[0])
ov.pl.embedding(adata, basis='X_umap', color='main_cluster',
                frameon='small', show=False)
plt.gcf()
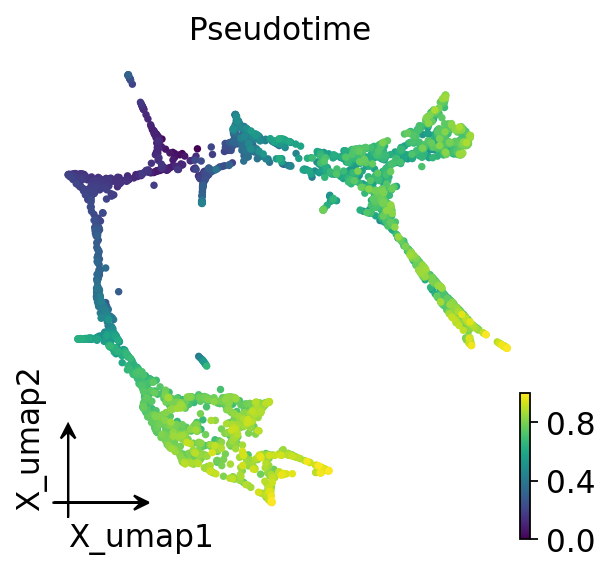
2. Lineage-specific pseudotime — CellOracle’s official recipe#
The bundled dpt_pseudotime is one global DPT and puts only Ery at
the high-pt end. For the PS analysis we need a pseudotime that’s
monotonic along both branches (ME = Ery / MEP / Mk and GM = GMP /
GMPl / Gran / Mo). ov.single.lineage_pseudotime wraps CellOracle’s
Pseudotime_calculator so this is one call.
ov.single.lineage_pseudotime(
    adata,
    lineage_dictionary={
        'Lineage_ME': ['Ery_0','Ery_1','Ery_2','Ery_3','Ery_4','Ery_5',
                       'Ery_6','Ery_7','Ery_8','Ery_9','MEP_0','Mk_0'],
        'Lineage_GM': ['GMP_0','GMP_1','GMP_2','GMPl_0','GMPl_1','Gran_0',
                       'Gran_1','Gran_2','Gran_3','Mo_0','Mo_1','Mo_2'],
    },
    root_cells={'Lineage_ME': '1539', 'Lineage_GM': '2244'},
    obsm_key='X_draw_graph_fa',
    cluster_column_name='louvain_annot',
)
AnnData object with n_obs × n_vars = 2671 × 1999
    obs: 'paul15_clusters', 'n_counts_all', 'n_counts', 'louvain', 'cell_type', 'louvain_annot', 'dpt_pseudotime', 'main_cluster', 'Pseudotime'
    var: 'n_counts', 'robust', 'highly_variable_features', 'means', 'variances', 'residual_variances', 'highly_variable_rank', 'highly_variable'
    uns: 'cell_type_colors', 'diffmap_evals', 'draw_graph', 'iroot', 'louvain', 'louvain_annot_colors', 'louvain_colors', 'louvain_sizes', 'neighbors', 'paga', 'paul15_clusters_colors', 'pca', 'history_log', 'log1p', 'hvg', 'status', 'status_args', 'REFERENCE_MANU', '_ov_provenance', 'main_cluster_colors_rgba', 'main_cluster_colors'
    obsm: 'X_diffmap', 'X_draw_graph_fa', 'X_pca', 'X_umap'
    varm: 'PCs'
    layers: 'raw_count', 'counts'
    obsp: 'connectivities', 'distances'
ov.pl.embedding(adata, basis='X_umap', color='Pseudotime',
                cmap='viridis', frameon='small', show=False)
plt.gcf()
3. Run the perturbation#
ov.single.perturb(..., backend='cell_oracle') propagates the
Gata1 KO through the base GRN, runs CellOracle’s
simulate_shift + calculate_embedding_shift, and returns a
PerturbResult with everything the downstream methods need.
result = ov.single.perturb(
    adata,
    target='Gata1', mode='ko',
    backend='cell_oracle',
    grn_base=base_grn, n_propagation=3,
    backend_kwargs={'cluster_column_name': 'louvain_annot',
                    'embedding_name': 'X_umap'},
)
result.summary(top_n=10)
[ov.single.perturb] target='Gata1' mode='ko' backend='cell_oracle'  — top 10 downstream genes by |Δexpr|:
   gene  mean_base  mean_pert     delta    log2_fc
  Gata1   2.566240   0.000000 -2.566240 -21.291225
  Ap2a2   1.909285   1.262324 -0.646961  -0.596950
Slc19a1   2.246588   1.610512 -0.636076  -0.480216
   Ctse   2.102368   1.480923 -0.621445  -0.505518
 Elavl1   2.456314   1.856095 -0.600219  -0.404224
  Ube2c   2.780668   2.210099 -0.570568  -0.331320
  Bola3   2.882679   2.318451 -0.564228  -0.314249
Snrnp40   2.849089   2.288974 -0.560114  -0.315799
   Aqp1   3.192047   2.644143 -0.547904  -0.271681
  Mrto4   3.136276   2.590842 -0.545433  -0.275631
| gene | mean_base | mean_pert | delta | log2_fc | |
|---|---|---|---|---|---|
| 739 | Gata1 | 2.566240 | 0.000000 | -2.566240 | -21.291225 |
| 175 | Ap2a2 | 1.909285 | 1.262324 | -0.646961 | -0.596950 |
| 1656 | Slc19a1 | 2.246588 | 1.610512 | -0.636076 | -0.480216 |
| 481 | Ctse | 2.102368 | 1.480923 | -0.621445 | -0.505518 |
| 603 | Elavl1 | 2.456314 | 1.856095 | -0.600219 | -0.404224 |
| 1907 | Ube2c | 2.780668 | 2.210099 | -0.570568 | -0.331320 |
| 271 | Bola3 | 2.882679 | 2.318451 | -0.564228 | -0.314249 |
| 1699 | Snrnp40 | 2.849089 | 2.288974 | -0.560114 | -0.315799 |
| 180 | Aqp1 | 3.192047 | 2.644143 | -0.547904 | -0.271681 |
| 1152 | Mrto4 | 3.136276 | 2.590842 | -0.545433 | -0.275631 |
4. Save / load — don’t re-run the GRN every time#
CellOracle’s GRN fit + simulation takes minutes. Persist the full
PerturbResult (delta_X, trajectory_shift, perturbed AnnData, GRN,
delta tables) to disk so downstream notebooks resume from a cache.
result.save('/tmp/gata1_ko_paul15.pkl')
result = ov.single.PerturbResult.load('/tmp/gata1_ko_paul15.pkl')
💾 Save Operation:
   Target path: /tmp/gata1_ko_paul15.pkl
   Object type: PerturbResult
   Using: pickle
✅ Successfully saved!
────────────────────────────────────────────────────────────
📂 Load Operation:
   Source path: /tmp/gata1_ko_paul15.pkl
   Using: pickle
✅ Successfully loaded!
   Loaded object type: PerturbResult
────────────────────────────────────────────────────────────
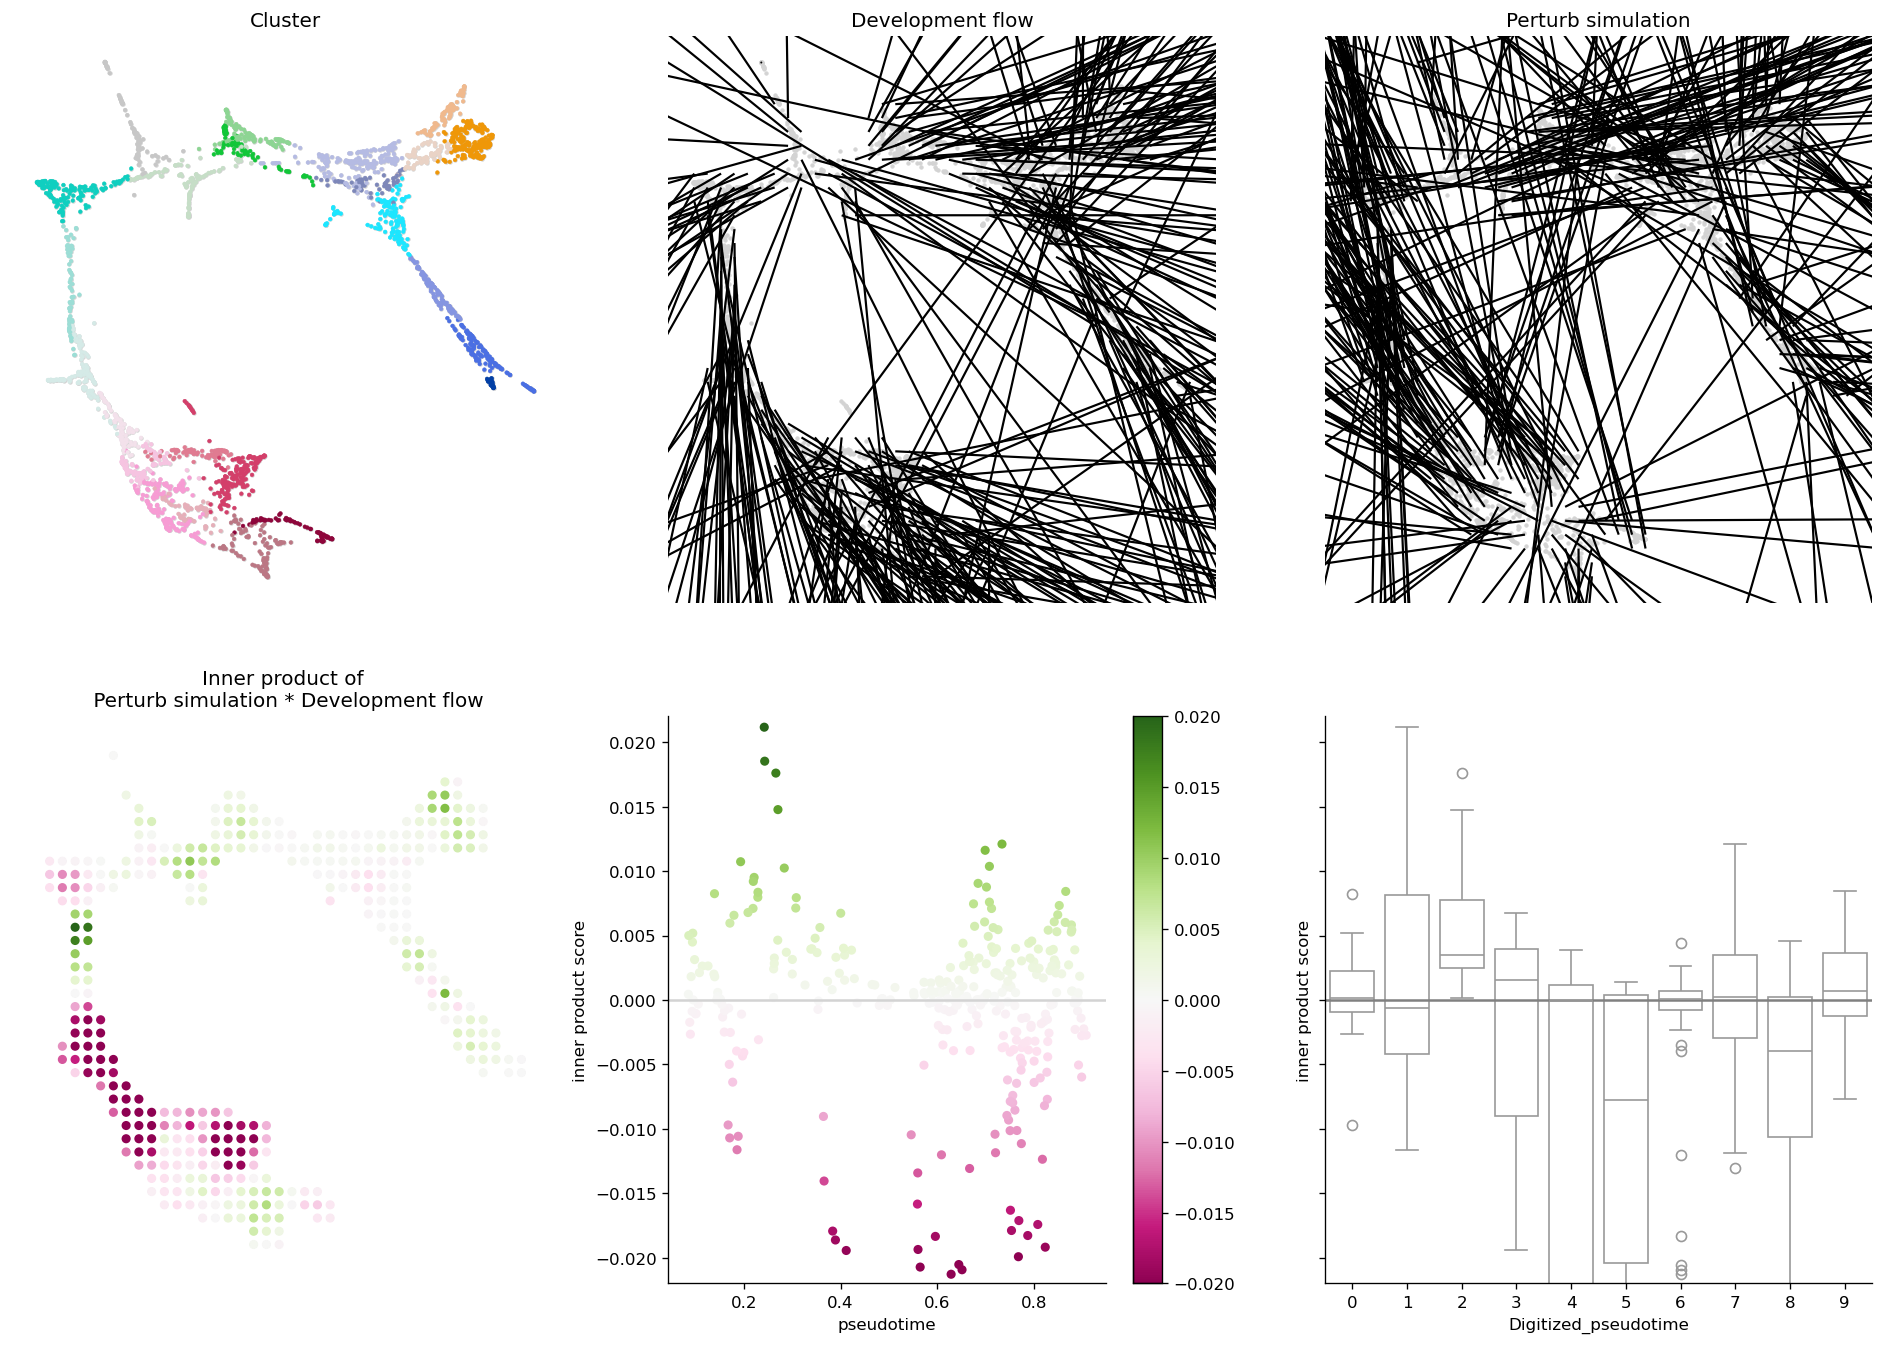
5. CellOracle’s official 6-panel layout#
ov.pl.perturb_celloracle_layout calls CellOracle’s own
Oracle_development_module.visualize_development_module_layout_0 —
1:1 with the published Gata1-KO Paul15 figure. The function works
on both cell_oracle and sctenifoldknk backends.
fig, _ = ov.pl.perturb_celloracle_layout(
    adata, result,
    pseudotime_key='Pseudotime',
    cluster_column_name='louvain_annot',
    vm=0.02,
)
fig
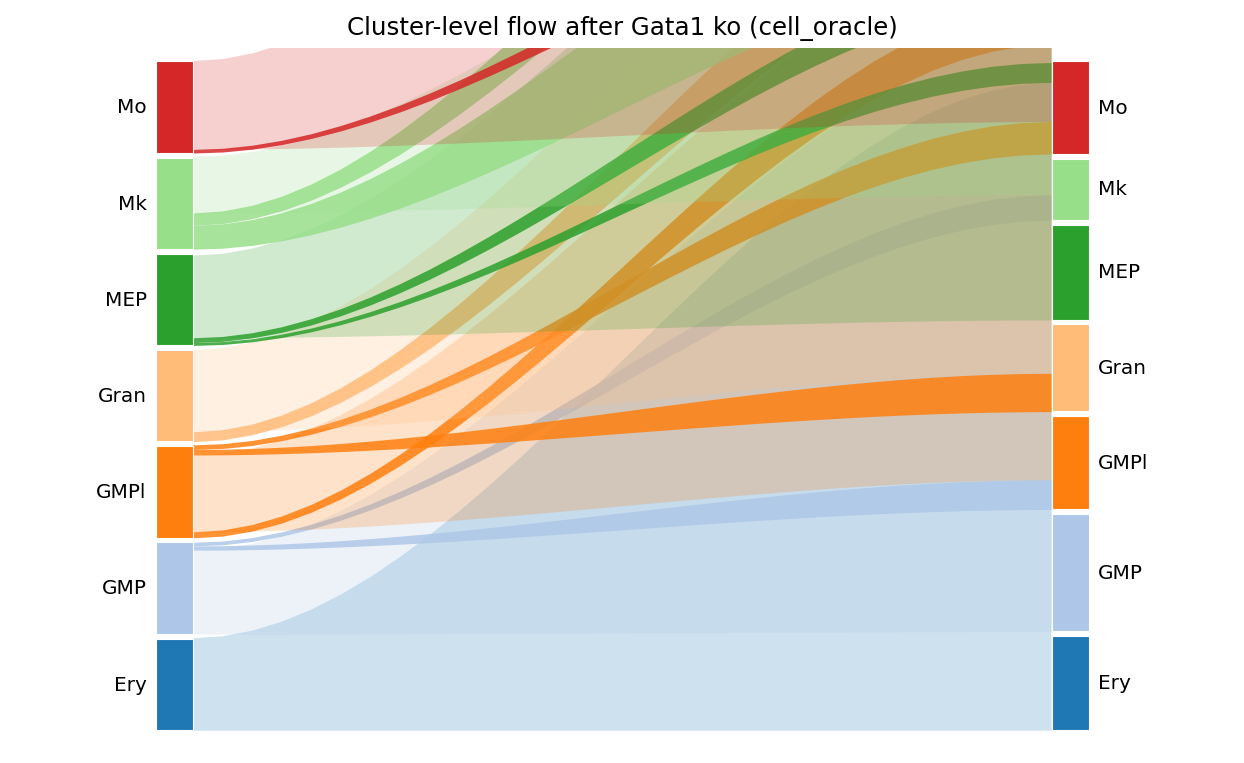
6. Cluster-level transition matrix + Sankey#
result.cluster_transitions(adata=adata, cluster_col='main_cluster').round(3)
| Ery | GMP | GMPl | Gran | MEP | Mk | Mo | |
|---|---|---|---|---|---|---|---|
| Ery | 0.996 | 0.000 | 0.000 | 0.000 | 0.004 | 0.000 | 0.000 |
| GMP | 0.000 | 0.902 | 0.046 | 0.003 | 0.010 | 0.039 | 0.000 |
| GMPl | 0.000 | 0.065 | 0.826 | 0.059 | 0.000 | 0.000 | 0.050 |
| Gran | 0.000 | 0.004 | 0.106 | 0.885 | 0.000 | 0.000 | 0.005 |
| MEP | 0.031 | 0.052 | 0.000 | 0.000 | 0.890 | 0.028 | 0.000 |
| Mk | 0.000 | 0.257 | 0.000 | 0.000 | 0.133 | 0.610 | 0.000 |
| Mo | 0.000 | 0.000 | 0.039 | 0.005 | 0.000 | 0.000 | 0.955 |
fig, _ = ov.pl.perturb_sankey(result, adata=adata,
                              cluster_col='main_cluster', min_flow=0.03)
fig
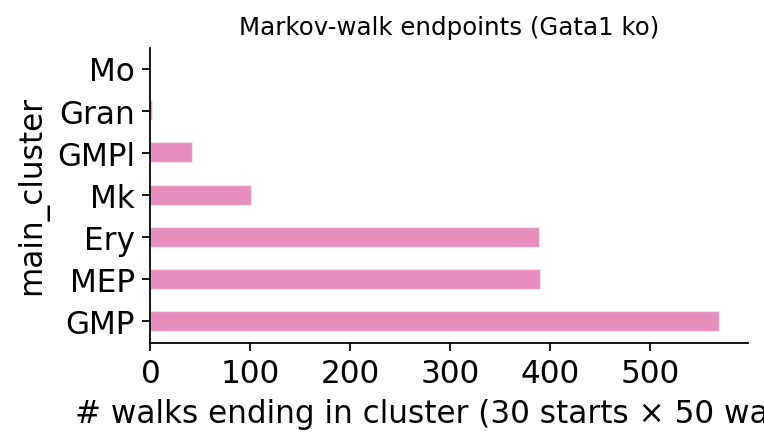
7. Markov-walk endpoints from MEP cells#
Where do MEP cells end up after 15 steps of the post-KO transition matrix? The canonical CellOracle finding is Mk → GMP redirect.
mep_cells = adata.obs_names[adata.obs['main_cluster'] == 'MEP'][:30]
fig, _ = ov.pl.perturb_markov_endpoints(
    result, adata=adata,
    start_cells=list(mep_cells),
    cluster_col='main_cluster',
    n_steps=15, n_walks_per_cell=50,
)
fig
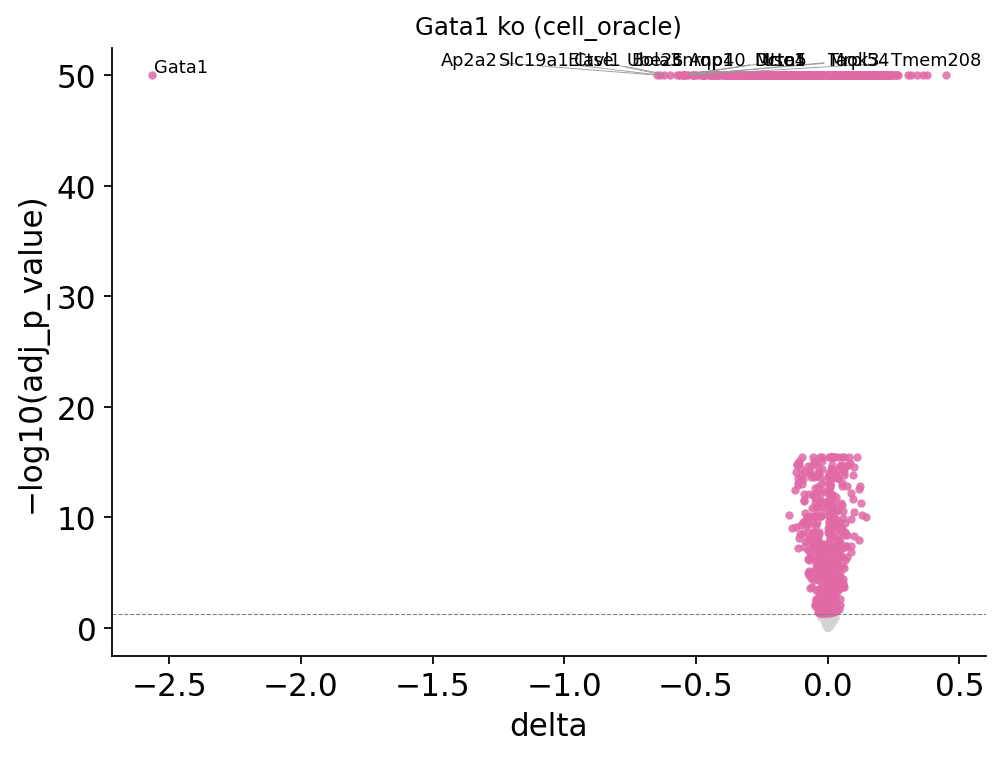
8. Per-gene significance + volcano#
result.add_significance(adata=adata, n_perms=100)
fig, _ = ov.pl.perturb_volcano(result, top_n=15)
fig
9. Pathway + phenotype enrichment#
The MGI mammalian-phenotype hits are the canonical Gata1 KO phenotypes — Abnormal Embryonic Erythropoiesis, Abnormal Megakaryocyte Differentiation, Increased Neutrophil Cell Number.
mgi = result.phenotype_enrichment(
    top_n=200,
    db='MGI_Mammalian_Phenotype_Level_4_2024',
    organism='mouse',
)
mgi.sort_values('Adjusted P-value').head(10)[
    ['Term', 'Adjusted P-value', 'Combined Score']
]
| Term | Adjusted P-value | Combined Score | |
|---|---|---|---|
| 0 | Decreased Hematocrit MP:0000208 | 0.018829 | 54.246440 |
| 1 | Preweaning Lethality, Complete Penetrance MP:0... | 0.035193 | 21.254706 |
| 2 | Abnormal Embryonic Erythropoiesis MP:0004229 | 0.085172 | 130.937480 |
| 3 | Decreased Eosinophil Cell Number MP:0005012 | 0.090484 | 75.832323 |
| 4 | Abnormal Megakaryocyte Differentiation MP:0000229 | 0.142312 | 159.519160 |
| 5 | Abnormal Respiratory Electron Transport Chain ... | 0.144431 | 78.646136 |
| 6 | Small Thymus MP:0000706 | 0.186198 | 37.681946 |
| 7 | Thymus Cortex Atrophy MP:0013585 | 0.214038 | 326.620610 |
| 8 | Polyploidy MP:0004025 | 0.223515 | 91.402614 |
| 9 | Abnormal Leukocyte Cell Number MP:0000217 | 0.250162 | 80.359050 |
10. Overall robustness — sign-flip null on Δ-X#
result.permutation_test(adata=adata, n_perms=100)
{'Z_obs': 11.399013254976625,
 'Z_mean_null': 0.7375057132390335,
 'Z_std_null': 0.1393375765751764,
 'p_value': 0.009900990099009901}
Summary#
Step |
API |
|---|---|
Lineage-specific pseudotime |
|
Run perturbation |
|
Save / load |
|
6-panel CellOracle figure |
|
Cluster transitions Sankey |
|
Markov endpoints |
|
Volcano + significance |
|
Phenotype enrichment |
|
Robustness |
|
References#
Kamimoto, K. et al. Dissecting cell identity via network inference and in silico gene perturbation. Nature 614 (2023).
Paul, F. et al. Transcriptional Heterogeneity and Lineage Commitment in Myeloid Progenitors. Cell 163 (2015).
omicverse issue #739 motivated this module.